Same saved payloads, same harness, two renderers
Sonnet 5.5, Express, oracle slice (3 types), run 1. Only the renderer differs: left is the 10 Oct 2026 snapshot, right is origin/main of 27 Oct 2026 (17 days later). T1 and T5 look the same; T2, T4 and T6 differ. One model, one run, five cells: this shows what changed for these saved outputs, it is not a measured rate of improvement. The price shown as $$9 in an earlier comparison came from a test-harness workaround, so that comparison is withdrawn and not included. The renderer still prepends a dollar sign to any price (defect R2 in the content check).
T1
10 Oct renderer
27 Oct renderer
T2
10 Oct renderer
27 Oct renderer
T4
10 Oct renderer
27 Oct renderer
T5
10 Oct renderer
27 Oct renderer
T6
10 Oct renderer
27 Oct renderer
Stills
Static images of the same pairs, in case the frames above do not load.
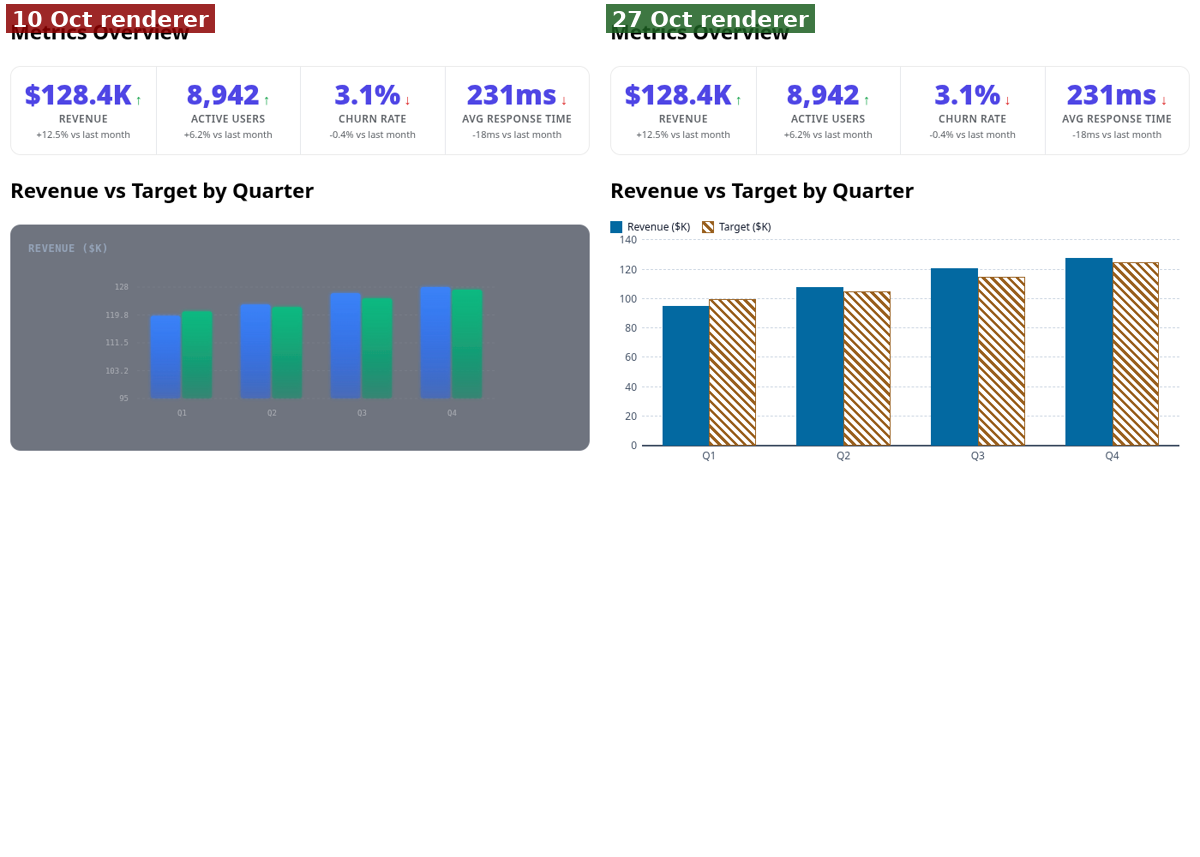
- T2, data display: left a dark grey chart with wrong axis labels (for example "183.2" between 111.5 and 95) and no legend; right a labelled bar chart with a legend and a 0-140 axis. A clear renderer difference.
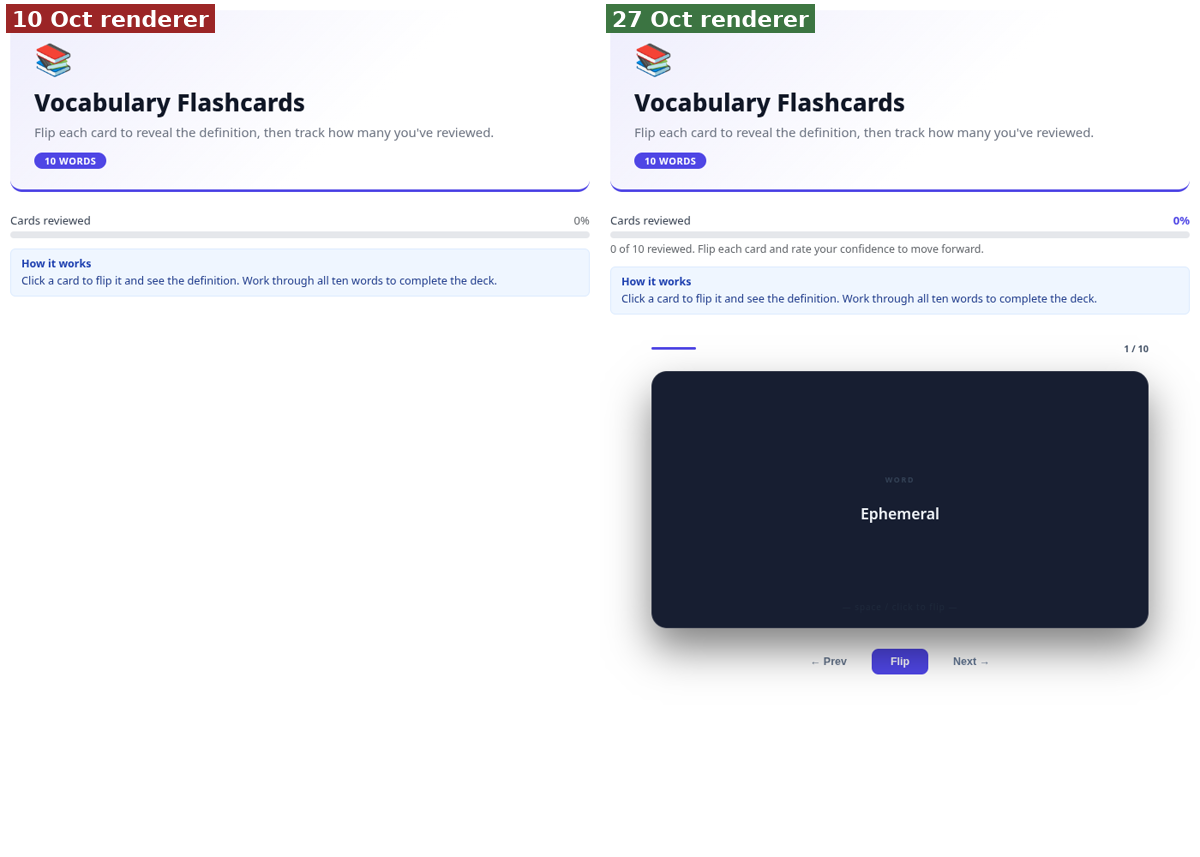
- T6, vocabulary flashcards: left the deck is missing (title, progress bar and note only); right the flashcard deck renders with Prev, Flip and Next. The flashcard_deck atom did not render on the old snapshot.
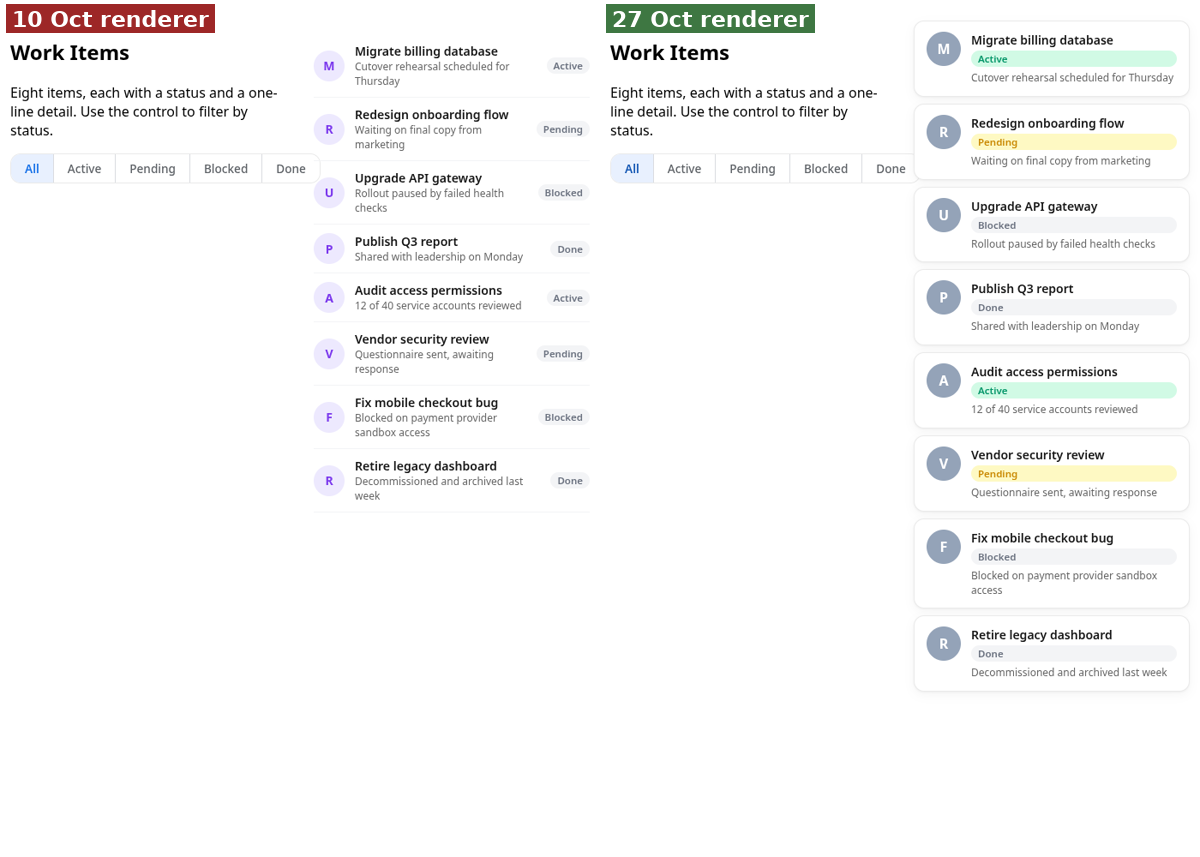
- T4, list of eight work items with a status filter: left plain rows; right rows as cards with status chips. The list is better styled, but in both columns the filter strip overlaps the list at this narrow width.
- Overview of T1, T2, T4, T5: T1 (lesson) and T5 (pricing) look the same in both columns. Not every cell improved.